Dr Joe's and Ken's Raster Elixir
MapCalc and Google Earth Heat Maps...
Vector is correcter - But Raster is Faster!
Here are some introductory examples of Google Fusion Tables as well as how to get Google Earth and Map Heat Maps working. And if you want a really neat FREE TOOL for spatial surface alegbra and abstractions try MapCalc.
MapCalcAcademic —
click on this link and select Open/Run to download MapCalc Academic self-extracting zip file. Follow the onscreen installation instructions. It is recommended that you accept the default specifications as the exercise write-ups assume this installation location.
UseSerial Number 158MA2-137821-V and Release Code 4A49-B687-E895-A5BB to register the educational MapCalc Academic version beyond the 14-day trial period. Note: under Windows 7, the request to register will continue to appear but once registered the software will not expire.
Some other examples of Heat Maps methods for Google Earth...
Some other examples of Heat Maps methods for Google Earth...

How to build a Heat Map in Fusion Tables
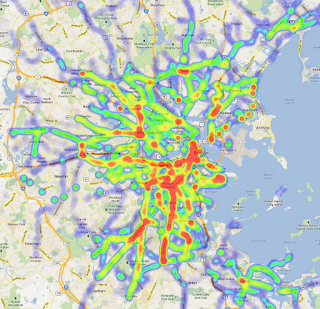
Walking Bostonian Google Fusion Heat Map
Heat Map of Transit in San Diego, part 2
Posted by Mark Zocher in Still Alive on February 15, 2011

When I first wrote about this project back in September, I had the idea of creating a heat map showing transit times to downtown (to help pick a new apartment for my girlfriend and me). What I didn’t have was a clue how to get started. Luckily, the amount of data manipulation tools has grown since Neil Kandalgaonkar attempted this a few years ago for San Francisco. After some tinkering, I settled on using Google Fusion Tables for my proof of concept.
Gathering the data
When I explored this back in September/October, there were very few options for getting transit data. Bing had just rolled out a transit option to their api, but the cities were limited (and didn’t include San Diego). My only option was to screenscrape the data from Google Maps, using a piece of PHP I created (with influence from Neil’s Code). The code is somewhat modular, so you can drop in your starting and ending latitude/longitude and destination. I wrote this with a small delay after each request (to keep from being banned by Google) and ran the code overnight from the command line (“php gettimes.php > results.txt”).
- My Code: gettimes.php
Displaying the data
Once I had my data, I discovered Google Fusion Tables was my best bet for displaying the data. Fusion Tables functions very much like a Google Spreadsheet, but you can select a column and “GeoCode” it – this declares the column as GIS data (either in latitude/longitude, KML, or an address). I used KML (think XML, but for geographic data) for each data point. While you can draw any polygon with KML, you can draw a square by defining the 4 corners and then repeating the first corner to close out the box.
An example KML entry:
-116.635,32.575 -116.635,32.585 -116.625,32.585 -116.625,32.575 -116.635,32.575
(My code didn’t generate each KML entry, though it easily could. I instead used an Excel formula to reformat the lat/long into the proper KML). Once the location is defined, it’s as easy as choosing Visualization->Map to display the contents!
I’ve created a new html template for the GMapCreator that uses Google’s API v3. In addition to not requiring the API key which is locked to the URL, this also means that you can take advantage of Google’s new styled maps base layers and Fusion table overlays.
The following map shows UK geology as the green overlay with a styled base layer called ‘Moody’:

Thanks to Steven Gray for the Moody style: http://bigdatatoolkit.org/
The GMapCreator template for creating Google API v3 maps can be downloaded from the following link:http://www.maptube.org/downloads/html-templates/template-APIv3.html
(you need to right click and ‘save as’, otherwise it will open in the browser).
Select this as the html template in the GMapCreator and it will create Google API v3 maps from shapefiles automatically. I’ll post some alternative base map styles once I’ve had a chance to experiment with it some more.
The following map shows UK geology as the green overlay with a styled base layer called ‘Moody’:

The green data overlay shows UK geology from GMapCreator tiles while the base layer is using the 'Moody' style
The GMapCreator template for creating Google API v3 maps can be downloaded from the following link:http://www.maptube.org/downloads/html-templates/template-APIv3.html
(you need to right click and ‘save as’, otherwise it will open in the browser).
Select this as the html template in the GMapCreator and it will create Google API v3 maps from shapefiles automatically. I’ll post some alternative base map styles once I’ve had a chance to experiment with it some more.
No comments:
Post a Comment